
Recently Fujisawa city in Japan issued a Smart City challenge targeting urban parks and newly gathered data (see City Challenge: Fujisawa Parks). Their goal, to better use data to manage city parks, an example of data-driven smart cities.
Leveraging the UTA matchmaking program
To address the challenge, UTA used its matchmaking program to bring together members NTTE, Kentyou and Nagoya University. The project team will develop a data analysis application that addresses the needs of Fujisawa city. UTA also reached out to non-member Porthofner who developed the city reporting app, Rakutoban, for Fujisawa. This will ensure that the proposed solution integrates tightly with Rakutoban.
Although the project is still ongoing, initial analysis provides some interesting results that will help address the needs of Fujisawa parks. These include:
Better understanding of park issues
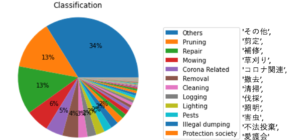 One of the first tasks was to get a better understanding of issues that were being reported by park staff, and by citizens. Combining historical data gathered over the last few years with recent data coming via the Rakutoban reporting application, allowed the team to build a simple dashboard that gave a graphical overview of the types of issues and their frequency.
Clustering for better categorization
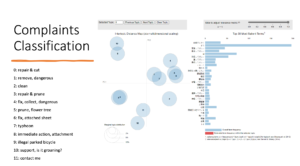 Initial analysis has led to a better understanding of the types and frequency of park issues. By combining historical incident reports with real time reports from the Rakutoban reporting app, city officials were able to see visualizations of the incidents. Although issues are generally categorized into specific types, initial analysis highlighted that many issues were reported as ‘other’ or ‘uncategorized’ which was not helpful to city staff. However by using advanced machine Learning techniques such as ‘clustering’ the project team were able to group incidents into similar clusters to give city staff a better understanding of the frequency of different types of issues.
Better visualization
A simple but effective tool has been to provide better visualizations of basic data for city staff. By offering a basic dashboard that allows staff to see different aspects of the parks data, they are better able to understand the current situation and main areas of concern.
This contrasts with the current situation where staff have excel spreadsheets with information which makes it hard for them to grasp the overall situation.
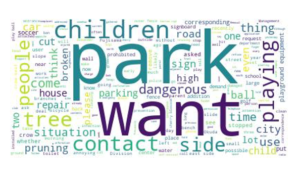
So as part of the basic dashboards, simple but effective visualizations, such as word clouds, have helped staff to better understand issues and so more effectively assign resources.
Improved planning capabilities
Another area of interest to Fujisawa is to improve their overall planning capabilities. Currently planning, as in most cities, takes considerable time, is carried out on an annual basis and often works on partial data and situational understanding. One area that is particulaly hard for city staff to handle is prediction of worksload because they have a complex mix of regular tasks and event driven talsk (when a staff or citizen issues is raised).
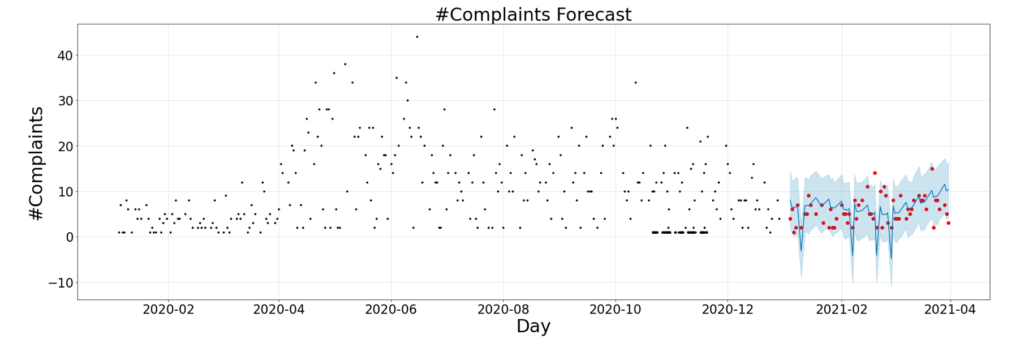 Prediction analysis
In addition to a better understanding of the types of issues that users and city staff report, the analysis has also helped longer term planning. This has been achieved using two techniques. Firstly by doing basic prediction of future incidents and so allowing staff to plan for seasonal variations in issues.
Correlation analysis

To try and understand better future capital spending on new equipment, a basic correlation analysis between equipment material and condition has been carried out. This has allowed staff to better understand which equipment lasts longer, and which equipment causes less issues by understanding the correlation between equipment degradation and the type of materials used. Using this simple analysis, the parks department able to improve improving future investment decisions.
Demographic analysis
A final type of analysis is using Japanese census data to understand better the demographics of the population living close to each park. This type of analysis allows the parks department to answer simple questions such as:
- Are any areas of the city lacking parks
- Which areas have the highest ration of parks to population
- Do parks in areas with many young children have sufficient play equipment
- Are the parks in areas where there are many older people have the right facilities
An initial analysis has developed a data set from the census data that uses 250m, 500m and 1km zones around each park to determine general demographics for users of that park. Although a simplified model it offer a step change in the information that the staff have at their disposal. The buffers are shown in the right of the screen shot below.
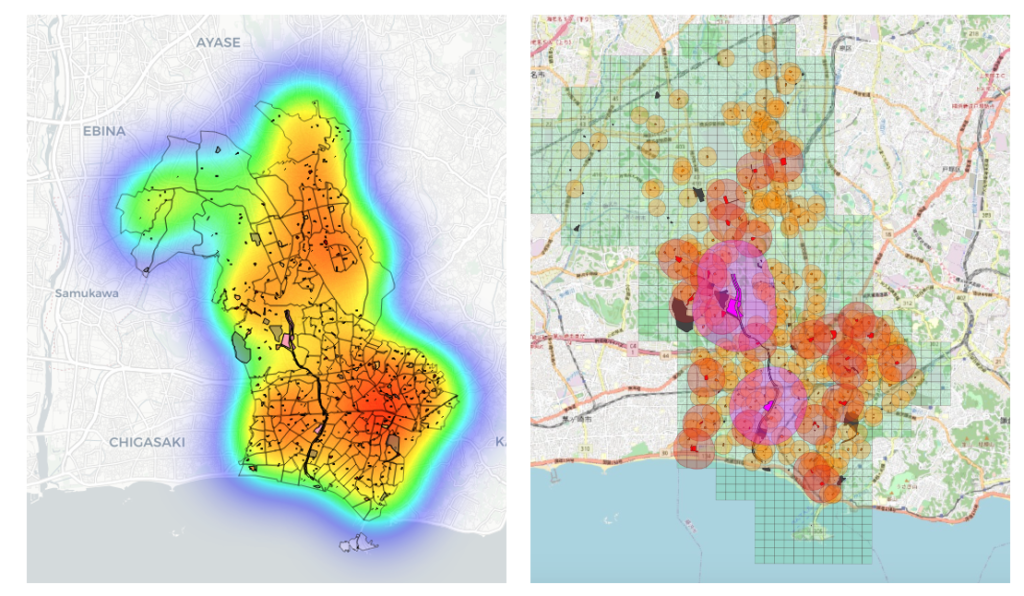
With this basic information, staff can now query the household and population mix associated with each parks.
At a higher level of abstraction, heatmaps such as the one shown above left, allows them to see density of parks meeting specific criteria so enabling them to understand which parks might need facilities upgraded or changes to meet the local needs of the population.
Conclusion
While this analysis is still at an early stage it is already providing Fujisawa parks with insights that they have not had before and points the way to future analysis that will improve how the parks department meets the needs of Fujisawa’s citizens.
If you’d like more information on this city challenge, or on how UTA’s matchmaking program can help you meet your Smart City goals contact us!